

JSCharting is a JS library for data visualization. It provide more than 150 charts and most importantly it can be implemented effortlessly using React.
Some important charts this library provides:
- Pie Chart
- Bar Chart
- Line Chart
- Donut Chart
- Gantt Chart
- Stock and Finance Charts
- Maps
and many more…
I also found the official JSCharting plugin for ReactJS git repository that allows users to see examples, implement and utilize the library conveniently.
Below is the example to implement a Bar Chart (Source GitHub):
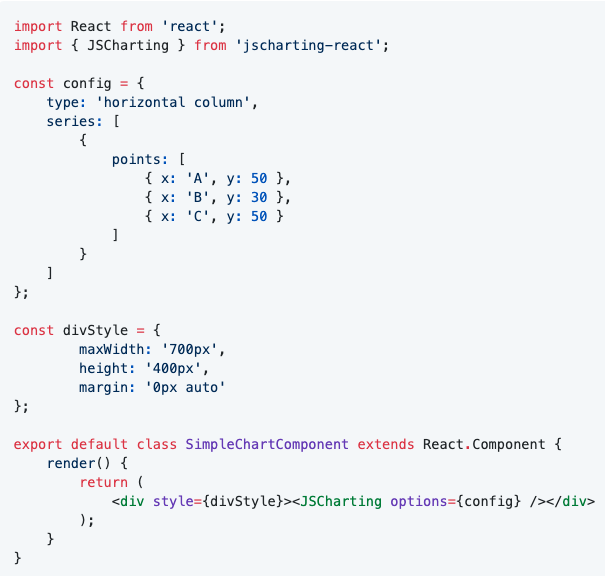
Developers can pass dynamic data as object to show on the charts or map and they can update it as well on different events like hover or click. So, according to the research I did and the charts I used (amcharts, chartjs and morris) previously, I can say that this is one of the best library with numerous interactive charts and compatible with ReactJS.
Research Source:
https://jscharting.com/
https://github.com/jscharting/jscharting-react